Before you hire RevOps for PLG, run the test
Most PLG & SaaS companies hire the wrong RevOps lead. Within 12–18 months, they’re burned out, mis-scoped, or gone. Why? Because leadership bought the story, not the outcomes.
We let you “try before you buy.” You get expert RevOps execution on your top revenue pain points before you commit to a full-time hire.
Hiring RevOps is risky because:
Job descriptions are vague (“fix our revenue engine”).
CROs churn every 18–24 months, resetting priorities.
Most hires inherit broken tools, data debt, and no budget.
The average mis-hire costs 6–12 months of growth and a six-figure burn.
What We Fix (Show, Don’t Tell)
We scope one high-impact workstream and prove it inside 30–60 days:
Speed to Lead → double inbound conversion
Forecast Accuracy → 95%+ reliability
Pipeline Visibility → eliminate “black hole” deals
Attribution That Holds Up → save marketing dollars
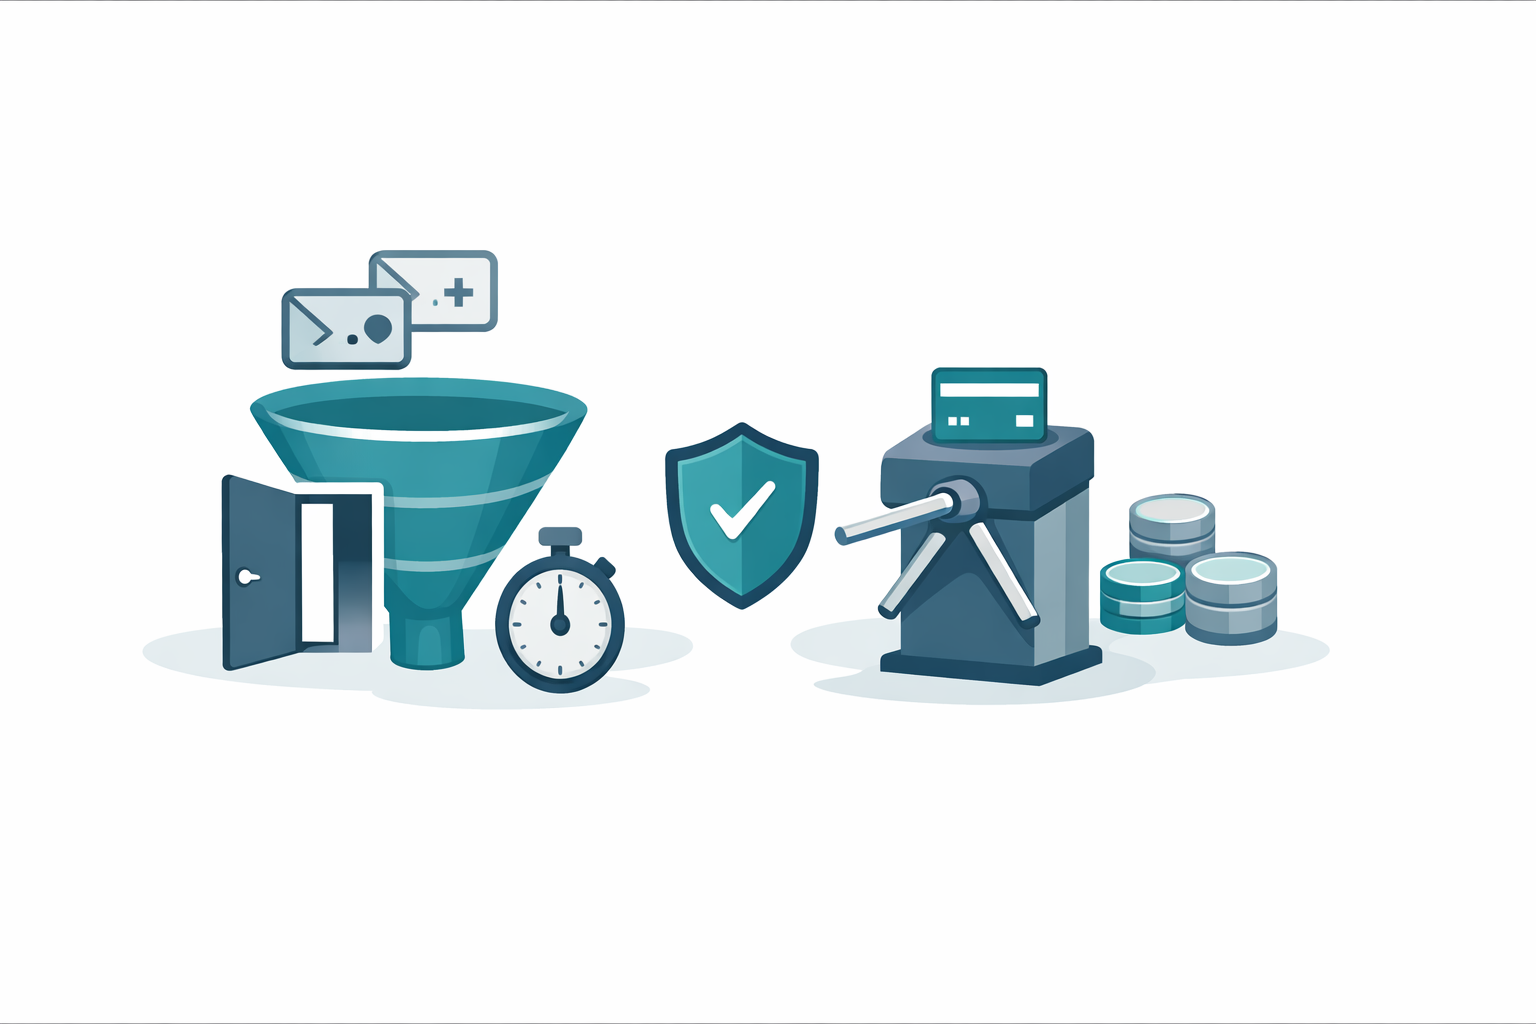
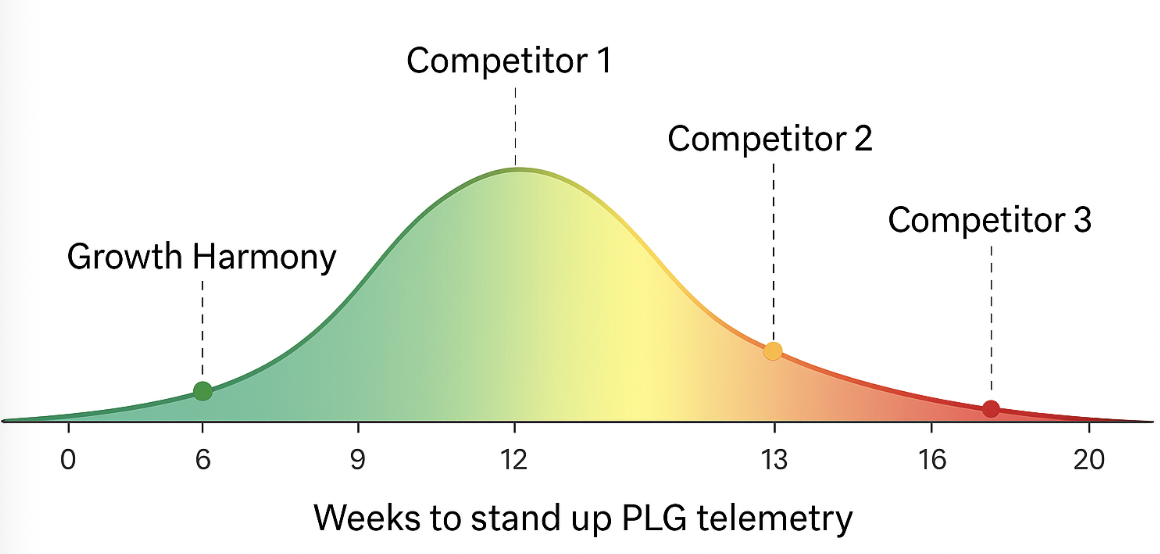
PLG Telemetry & Journey Mapping → turn usage data into revenue signals
Retention Risk Reporting → stop churn before it starts
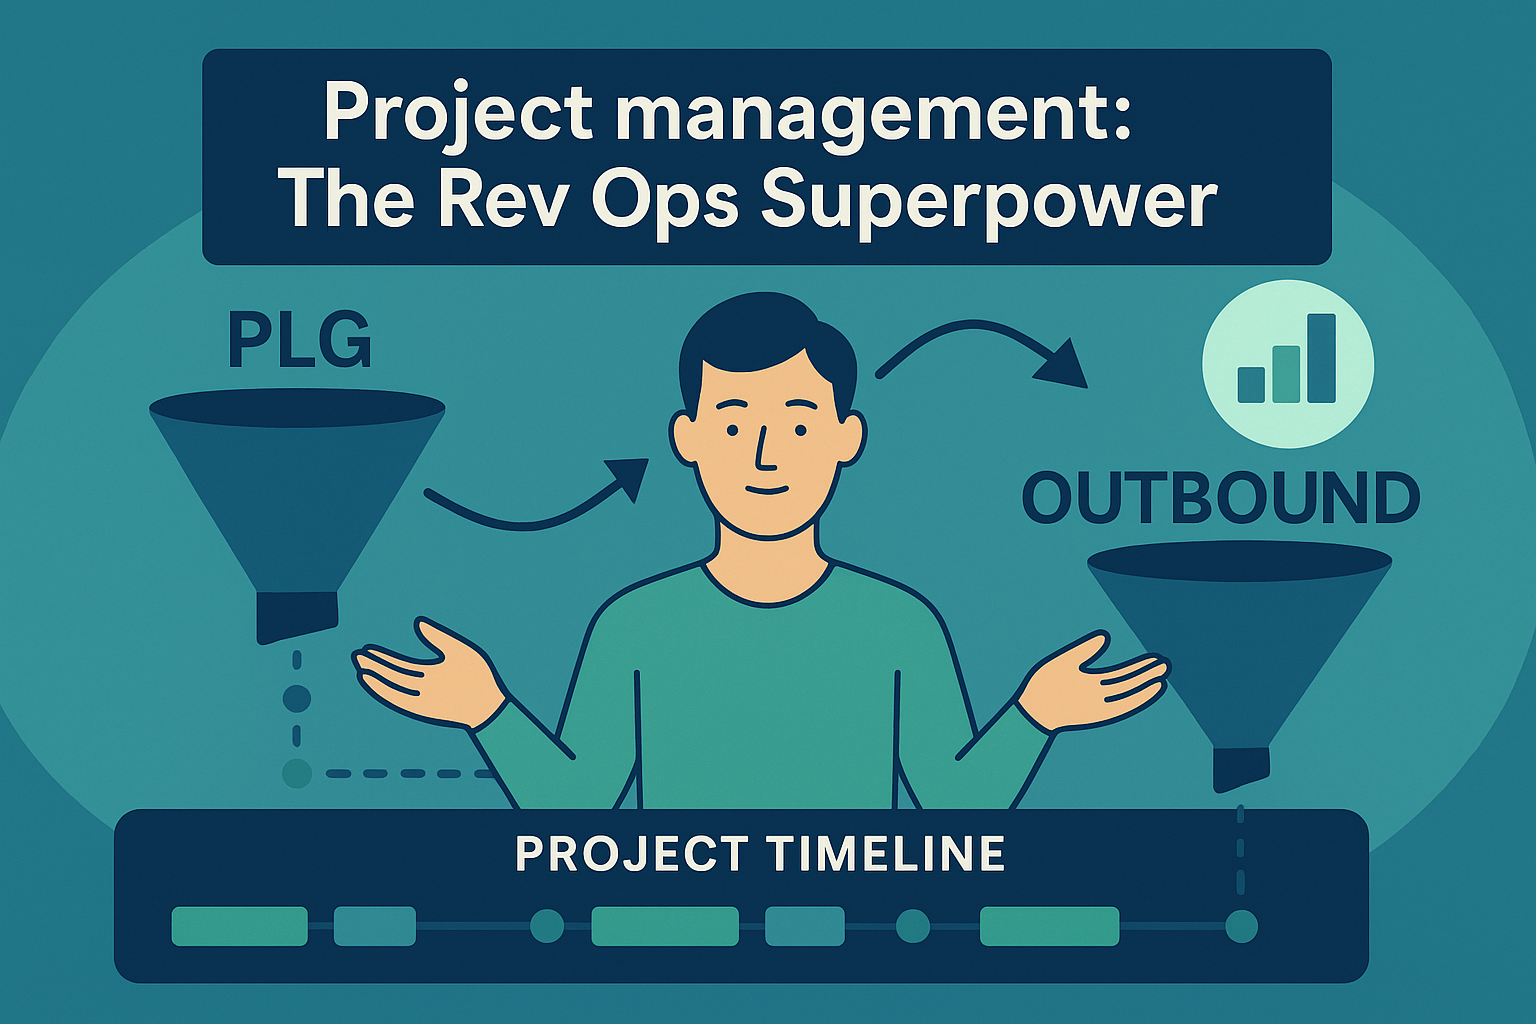
Fractional RevOps Trial
You keep your hiring plan.
We join your hiring committee, build the scorecard, and stress-test candidates.
While you search, we fix the one problem slowing you down right now.
End result:
A working RevOps system delivering results.
A clear charter and roadmap for the full-time hire.
Confidence you’re not gambling $250k+ on the wrong person.
Forecast Accuracy
Executive GTM Dashboard
Book a 30-minute strategy session.
We’ll never sell your info

Speed to Lead
Customer Journey Mapping

Multi-Touch Marketing Attribution and Campaign Cost Mapping


GTM Strategies